Business Intelligence for SMEs
Turning business data into decisions
Business Intelligence is the process that transforms a company’s operational data-accounting, billing, cash, commercial-into readable, up-to-date, decision-useful indicators. It is not a tool for large companies: it is a concrete answer to a problem facing any SME that wants to understand where it is going before the numbers surprise it.
What is business intelligence and why an SME needs it
Business Intelligence (BI) is the set of processes, tools and models that enable a business to collect its data, organize it in a readable format and transform it into useful management information.
An SME produces a significant amount of data every day: invoices issued and received, bank movements, personnel costs, business performance, margins by product or order. The problem is not a lack of data-it is that this data is spread across different systems, updated at different times, and almost never read in a coordinated way.
A business intelligence system solves exactly this: it builds a single, updatable and interpretable information environment in which enterprise data become a resource for making better, earlier and more informed decisions.
The difference from simple accounting reporting is substantial: BI does not take a snapshot of the past, but allows you to monitor the present and anticipate trends.
From raw data to decision indicator: how it works
An effective business intelligence system is built in four stages.
Integration of sources. Data come from different systems: management software, accounting, electronic invoicing, CRM, Excel sheets, banking platforms, payroll systems. The first step is to link these sources in a structured way, without duplication or loss of information.
Normalization and data quality. Before being visualized, every piece of data must be validated, cleaned and made consistent. Wrong data in input produces a wrong indicator in output: the quality of the BI system depends entirely on the quality of the source data.
Definition of indicators (KPIs). Not all data are equally useful. Each company has its own critical indicators: margin per job order, personnel as a percentage of sales, average days to collection, deviation from budget. Defining them precisely is an integral part of the project.
Visualization and updating. Only then does the data become dashboards, charts, tables, and periodic reports-readable, automatically updated, and accessible to decision makers.
The most popular BI tools in 2026: which one to choose for your enterprise
There is no one-size-fits-all business intelligence tool. The choice depends on the size of the enterprise, the systems already in use, the volume of data and the control objectives.
Microsoft Power BI is now the most popular platform among Italian SMEs using the Microsoft ecosystem. It integrates Copilot features for conversational analysis, automatic DAX formula generation, and support for data interpretation. 2026 evolutions include Direct Lake, advanced mobile analytics, and connectivity with Microsoft Fabric.
Microsoft Fabric is Microsoft’s unified platform for enterprise data management: it integrates data engineering, data warehouse, BI and AI in a single environment. Suitable for enterprises with complex integration needs.
Google Looker integrates Gemini for natural language data querying: the user can ask operational questions and get automatically generated charts or tables from the query. Suitable for enterprises already in the Google Workspace ecosystem.
Qlik is positioned on augmented analytics: integrated AI Assistant, predictive AI, automatic anomaly detection and automation of analytic processes. Strong in integrations with complex ERPs.
Tableau (Salesforce) is the gold standard for advanced data visualization. Suitable for enterprises with structured analytic teams or highly articulated data representation needs.
For an SME starting from scratch, the most frequent choice is Power BI, because of its value for money, spread of operators, and native integration with Excel and Microsoft 365.
Business Intelligence and AI in 2026: RAG, LLM and natural language data querying
Business Intelligence of 2026 is not limited to the graphical representation of data. Integration with artificial intelligence models-particularly Large Language Models (LLMs) and Retrieval Augmented Generation (RAG) architectures-opens a whole new level of analysis.
What it means in practice. Through a RAG system, business data-not only numerical tables, but also documents, contracts, internal reports, procedures, minutes, and administrative records-can be linked to a natural language query engine. The user asks a question (“what is the average margin of the first quarter’s orders?”, “which customers have exceeded 90 days of payment?”) and the system responds by drawing directly from corporate sources.
What becomes possible with an evolved system:
- Query economic and financial data without building manual reports
- Compare periods, orders, or customers with a direct question
- Automatically detect anomalies in the data
- Retrieve information from business documents in seconds
- Synthesize reports, minutes, and administrative content
- Support management control and planning with immediate analysis
A key point. Augmented analytics does not replace professional monitoring and critical reading of data-it speeds it up. The speed of accessing the right information at the right time is the real advantage.
What does an SME concretely monitor with a BI system
A business intelligence system enables continuous monitoring of the indicators that most impact the health of the enterprise.
Area | What is being monitored |
|---|---|
Cheap | Revenues, margins per customer/product/order, fixed and variable costs, EBITDA |
Financial | Cash flows, exposure to customers and suppliers, average days to collection and payment |
Commercial | Performance by agent/area/channel, conversion rate, order book |
Labor cost | Percentage impact on turnover, costs by department, overtime, absenteeism |
Budget vs. actual | Monthly and cumulative deviations, analysis of the causes of deviations |
Operational | Production efficiency, yield per job order, processing time |
A concrete example. A manufacturing company with 15 employees and three product lines may discover, through a BI system integrated with management, that one line produces 60 percent of sales but only 30 percent of margin–information that normally only emerges at the end of the year, when it is late to take action.
Governance and security: who accesses the data and how it is controlled
A business intelligence system that works is not just a system that produces correct reports-it is a governed system.
Governance means defining precisely: who can access what information, what indicators are official and from what source, how sources are updated and how often, what consistency checks are applied, and who is responsible for validating the data.
Without these rules, the risk is that multiple versions of the same data coexist, read by different people at different times, with contradictory results.
Security, on the other hand, is about protecting business information: role-profiled access, query logs, separation of production and analysis environments, and GDPR compliance for data that includes personal information.
For enterprises integrating AI and RAG systems on their document assets, these rules become even more critical: language models interrogate available sources-and it is essential that the sources are accurate, up-to-date and properly perimetered.
How Beneggi Associates supports SMEs in business intelligence
Beneggi Associati is a professional firm based in Lombardy that supports small and medium-sized companies in building systems to read and control business data, integrating accounting, tax, management control and technology skills.
The value of the firm’s approach is not technical in the strict sense-it is professional. Building an effective business intelligence system for an SME requires knowing what indicators really matter for that specific enterprise, how to read accounting data from a management perspective, where inefficiencies in administrative flows are hiding, and how to integrate information already available without multiplying systems.
The typical route includes three stages:
- Analysis of available sources. Mapping the systems in use (management, accounting, CRM, Excel sheets, banking) and assessing the quality and completeness of existing data.
- Definition of indicators and data model. Identification of relevant KPIs for the enterprise, construction of the source integration model and definition of the updating rules.
- System construction and maintenance. Implementation of dashboards, periodic reports and, where appropriate, AI-based advanced query systems. Ongoing coaching to interpret data and update indicators as needs change.
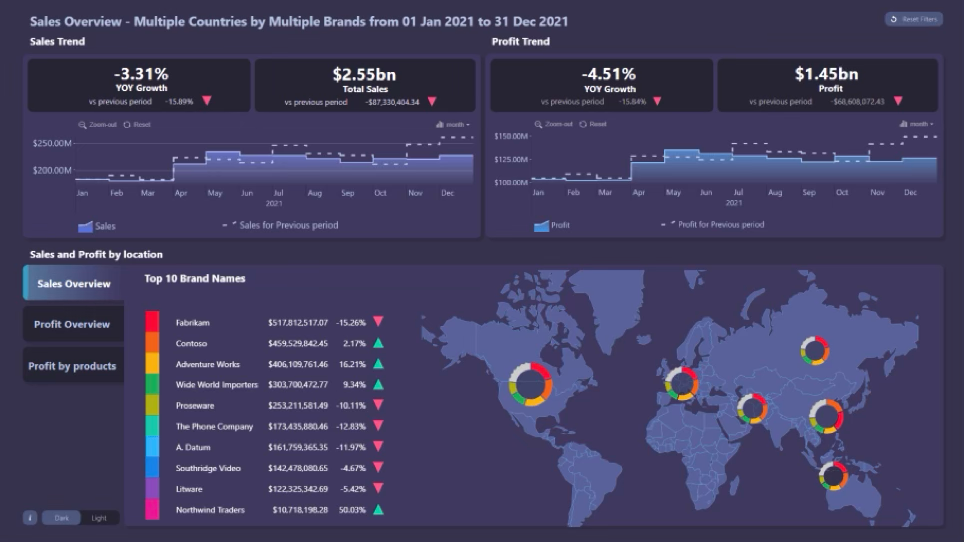
Example of a dashboard
Frequently asked questions about Business Intelligence for SMEs
What is business intelligence in simple terms?
Business Intelligence is the process that transforms data already in the company-accounting, sales, costs, cash-into information that is readable and useful for decision-making. It is not a specific software, but an approach that can be implemented with different tools depending on the needs of the business.
What is the difference between business intelligence and management control?
Management control is a professional process of planning, monitoring and analyzing business performance. Business Intelligence is the technological tool that supports and accelerates this process, making data available in real time and in readable form. The two areas are complementary, not alternatives.
Does an SME really need a BI system?
It depends on the complexity of the enterprise. If the entrepreneur struggles to quickly answer questions such as “what is my margin per customer?”, “how long does it take me on average to collect?” or “am I meeting budget?” then a BI system-even a simple one-brings an immediate benefit. There is no need to start with a complex platform: in many cases, it is enough to properly structure the data already available.
What is the cost of a business intelligence system for a small business?
Costs vary significantly depending on the complexity of the systems to be integrated and the tools chosen. Solutions such as Power BI have low licensing costs (from a few tens of euros per month per user). The main cost is that of design, source integration and maintenance-activities that depend on the specific situation of the enterprise.
What is a RAG system and how does it relate to business intelligence?
RAG (Retrieval Augmented Generation) is an architecture that enables an AI model to answer questions by drawing on specific information sources-in the business case, its own data, documents and archives. Integrated into a BI system, it allows business information to be queried in natural language, without building a manual report each time. It is one of the most relevant evolutions of BI in 2026.
How long does it take to get a BI system up and running?
For a basic system–integrating two or three sources, defining a set of KPIs and building the first dashboards–the time is on the order of weeks, not months. For more articulated systems, with integration of multiple heterogeneous sources and complex analysis logic, the time is longer. In any case, a phased approach allows for useful results already in the first few weeks.
Is business data safe in a BI system?
Yes, if the system is designed correctly. This means role-profiled access, separation of environments, query logs, and GDPR compliance. Security is not an automatic function of the tools-it is a design choice that must be planned from the beginning.